Sources and licences
MeteoWeather combines weather, geographic and climate data with its own presentation and explanatory text. Attribution does not imply an official partnership or endorsement. Check the issue time and product shown with each weather view.
Forecasts: MET Norway
Local forecasts use data from the Norwegian Meteorological Institute, MET Norway, under CC BY 4.0. MeteoWeather formats and summarises the data and is responsible for those changes. A model point does not represent every street, slope or observing station nearby.
Historical monthly climate: NASA POWER
Monthly climate references describe the historical period 2001–2020 and come from NASA POWER, with meteorological data based on products including MERRA-2 reanalysis. The reference location is identified; where a nearby locality supplies the reference, the associated distance is shown. These are gridded data, not measurements from a weather station in every town. A monthly mean daily precipitation value in mm/day is neither a rain probability nor the amount forecast for the selected date. It is not a daily forecast series for the next 25 years.
Places and coordinates: GeoNames
Place names, coordinates, country information and map bounds use selected and adapted GeoNames data under CC BY 4.0. Detailed place datasets cover the United States, United Kingdom, Canada, Australia, New Zealand and Ireland. National dataset coverage does not guarantee that every small settlement is present. The United Kingdom includes Northern Ireland; Ireland is a separate country. The worldwide section has country and territory maps and named capital forecasts where available, not a complete directory of every world city.
Country names: Unicode CLDR
Country and territory names use Unicode CLDR under Unicode License V3. Copyright © 1991–2026 Unicode, Inc. Names are selected and formatted for the service. The complete copyright and permission notice is included in the package documentation.
Map coverage and interpretation
A worldwide map does not prove that ground-based radar observations exist at every point. Coverage, time intervals and products depend on the provider. Satellite imagery, precipitation estimates and forecasts are different sources. A forecast for a named locality is not an average temperature for its whole country. CAPE shows an ingredient for thunderstorms; snow depth describes snow on the ground; the sun view uses cloud cover; the fog view is a model estimate.
Warnings and national authorities
Automatic warning selections are integrated for the United Kingdom and Ireland using Meteoalarm/EUMETNET feeds under CC BY 4.0 and their attribution requirements. The interface can display a selection rather than every bulletin. For the United States, Canada, Australia and New Zealand, this version provides links to the official national sources rather than claiming an integrated live warning feed. The country profiles identify the NWS, UK Met Office, Environment and Climate Change Canada, Bureau of Meteorology, MetService and Met Éireann. Read the original jurisdiction, hazard and valid period; warning colours and types are not a universal international scale.
I’m Weather / Infoplaza maps
I’m Weather supplies official weather, radar and satellite widgets. Its free offer permits business websites. The required logo and link inside the widget remain visible. Its terms and privacy policies apply; a generic map label on our page does not remove the provider’s attribution.
Ventusky maps
Other interactive layers use the official free Ventusky embed. Required branding and map credits remain in place. The available language, units and controls depend on supported provider features and, for some settings, the visitor’s browser. The embed’s privacy description is specific to that product and is not a promise about every external map service.
Photography
The landscape photograph is hosted with the website. Its image record below identifies the photographer, original source, licence and modifications, including resizing and WebP conversion. Page layouts may crop the edges. It is an illustrative landscape, not a live weather image. Required attribution remains available with the source record.
Calendar and climate scenarios
The calendar separates near-term forecasts, historical monthly averages and astronomical calculations. Daylight duration is not a forecast of sunshine hours. The climate outlook uses IPCC assessments and official scientific sources. Global warming ranges are not local temperatures and are not artificially extended beyond their assessed period.
Reuse and corrections
When reusing open material, follow its particular licence, identify its source and describe changes where required. MeteoWeather does not claim ownership of the original open datasets. Send attribution questions or possible errors to info@olphy.com.
Rain radar & weather maps
On the Forecast tab, drag the map to move around. Use + and − to zoom. Zoom controls return to the selected location.
Radar shows available observations. Blank areas may be outside coverage. This layer is a forecast. Check its selected time.
Country overview. Select the map to open its source; choose Forecast to pan and zoom here.
Only the selected map loads, keeping unnecessary data use low. Interactive maps load from external providers.
Sources & licences
- MET Norway · forecast documentation
- MET Norway · CC BY 4.0 licence
- GeoNames
- GeoNames · data and CC BY 4.0 licence
- Unicode CLDR
- Unicode License V3
- Meteoalarm / EUMETNET
- I’m Weather / Infoplaza · official map widgets
- Ventusky · official map embedding
- Ventusky · privacy information
- Infoplaza · privacy information
- Creative Commons Attribution 4.0
GeoNames · 2026-10-08 · 283,770 places and neighbourhoods in this directory.
Photo credit
Willow Flats area and Teton Range in Grand Teton National Park
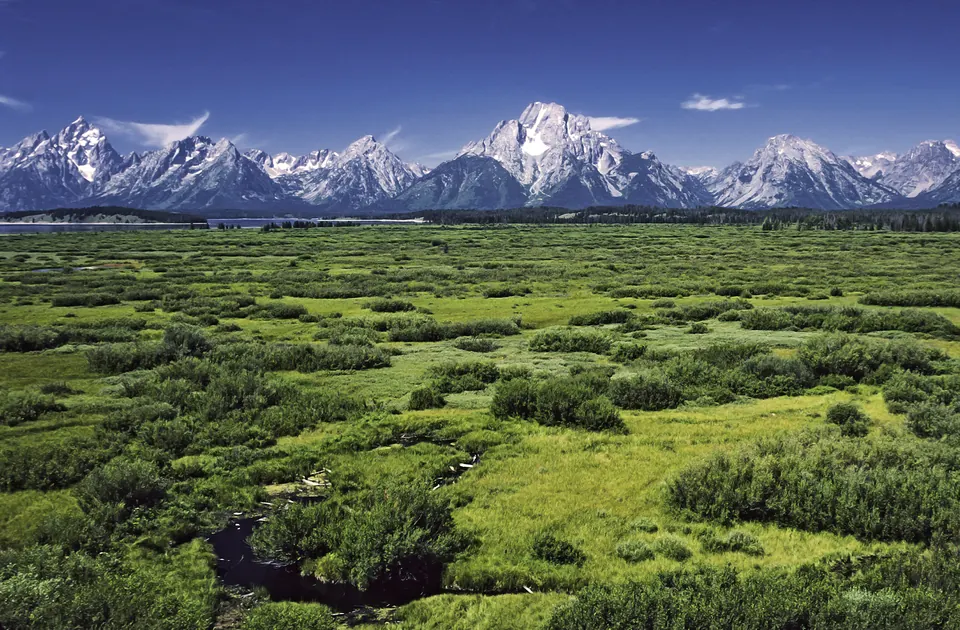
The Teton Range and Willow Flats in Grand Teton National Park, Wyoming, United States, photographed in July 1980. This is a landscape photograph, not a live weather image.
Michael Gäbler · Original photograph and licence · CC BY 3.0

Resized from 1,811 × 1,189 to 960 × 630 pixels and converted to WebP. No generative changes. Page layouts may visually crop the edges. The social preview combines the photograph with Meteo Weather text and graphics.
Seasons & weather
- US National Weather Service — Why Do We Have the Seasons?
- World Meteorological Organization — Climate
- Australian Bureau of Meteorology — Australian climate zones
- Australian Bureau of Meteorology — Monsoon
- British Antarctic Survey — Temperatures in Antarctica
- Met Office — Mountain forecast guide
- US National Weather Service — Radar rainfall estimation
- NOAA NESDIS — Satellite Rainfall Estimation (SCaMPR)
- WMO — Common Alerting Protocol
- Met Office — understanding warnings
- US National Weather Service — Understand Severe Weather Alerts
- National Weather Service — official alerts
- National Weather Service — tornado watches and warnings
- National Hurricane Center
- National Weather Service — warning definitions
- Met Office — UK weather warnings
- Met Office — how warning colours are assessed
- Met Office — radar products
- Environment and Climate Change Canada — weather and alerts
- Environment and Climate Change Canada — colour-coded weather alerts
- Canada’s Changing Climate Report — changes in the water cycle
- Bureau of Meteorology — warnings and alerts
- Bureau of Meteorology — finding warnings
- Bureau of Meteorology — fire-weather services
- Bureau of Meteorology and CSIRO — State of the Climate
- MetService — official warnings
- MetService — severe-weather warnings
- Earth Sciences New Zealand / NIWA — regional climate context
- Met Éireann — current warnings
- Met Éireann — weather warning system
- Met Éireann — climate and climate change
Weather map guide
- Met Office — radar products
- Infoplaza — official weather widgets
- Ventusky — map variables and interpretation
- Met Office — how wind is measured
- ECMWF — snow depth and sea ice
- Met Office — snow
- Met Office — weather map layers
- National Weather Service — dew and frost
- EUMETSAT — Earth view
- EUMETSAT — satellite imagery interpretation
- Met Office — sunshine, cloud and visibility measurements
- National Weather Service — thunderstorm development
- National Weather Service — understanding CAPE
- Met Office — UV levels
- Met Office — fog
- Met Office — fog and travel
Weather calendar
Weather values use available forecast data for the selected date. Climate values are historical monthly means for the stated reference period and location. Daylight comes from astronomical calculations. These describe different things and are labelled separately; missing data are not replaced with invented daily forecasts.
Historical monthly averages come from NASA POWER/MERRA-2 model grid cells (0.5° latitude × 0.625° longitude), for 2001–2020. They are not weather-station readings or forecasts for a future date. The named reference, grid center and distance are shown beside each value.
As the climate changes, familiar patterns of temperature, rainfall and snow can shift. Historical averages provide a reference, not a guarantee for future years. Climate projections describe possible longer-term changes under stated assumptions; they do not predict the weather on your selected day.
Climate outlook
- IPCC AR6 — global temperature scenarios, Table SPM.1
- IPCC AR6 Synthesis Report — scenarios and long-term change
- IPCC AR6 — North America
- Environment and Climate Change Canada — changes in the water cycle
- Met Office — climate change in the UK
- Met Éireann — TRANSLATE climate projections
- Bureau of Meteorology and CSIRO — future Australian climate
- Earth Sciences New Zealand / NIWA — climate-change scenarios